Ranking Electrical Disturbances — Part 1 of 7
This article starts a seven-part series on the effects of power quality disturbances on a five-stage electronic LED driver. As electrical designers, we know each circuit has a characteristic frequency response, meaning that signals of some frequency can get through a circuit, and others cannot. The same is true when you talk about the effects of power quality (PQ) disturbances on electronic ballasts. Each disturbance category has its own frequency characteristics as well.
For example, the most commonly occurring disturbance is a voltage sag. Sags are slow disturbances, containing mostly 60-Hz energy. However, they also typically contain some higher frequency disturbance energy mixed in with the sag. But sags and transients can cause driver malfunctions and failures. The type of malfunction and failure that occurs in a driver versus the type of disturbance(s) that are applied to the AC input voltage depends on the driver’s design.
Disturbance diagnosis
To the average person in a factory setting with a watchful eye, a flickering light or “bump” in the night typically elicits the response: “There goes another power surge.” However, to an up-and-coming PQ engineer, these might be the signs of trouble to come for recently installed LED lighting systems (and other electrical/electronic equipment). Traditional lamp types — incandescent, fluorescent, and high-intensity discharge (HID) — have always been good indicators that an electrical PQ disturbance just occurred. These light sources respond to almost every form of electrical disturbance. A small change in the quality of the voltage on the AC input will typically produce a larger change in the current flowing through a lamp. With an electronic power supply between the AC input and the output to the lamp, it doesn’t take much change in voltage to cause a noticeable effect on the light output. Surprisingly, electronic-based LED lighting devices are no different. In fact, disturbances can have a more pronounced effect on the LED light output than other traditional light sources.
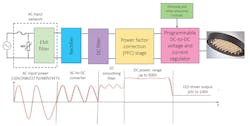
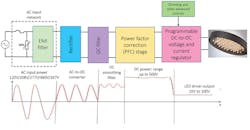
Figure 1 illustrates a typical simplified block diagram for a programmable LED driver with its basic voltage waveforms. The AC input voltage is applied to the AC input network, which consists of the AC line fuse and some form of a surge protection network. The surge protection network here consists of one MOV (most LED drivers use only one MOV). The next stage is the bridge rectifier. This stage rectifies the AC input voltage. The third stage is the DC smoothing capacitor, which is typically two electrolytic capacitors. The fourth stage is the power factor correction (PFC) stage. The PFC stage is responsible for detecting the shape of the AC input current and the amount of phase shift between the AC input voltage and the current. The PFC stage is typically where the first power electronic transistor in the circuit is located.
The PFC stage is where energy is first stored in the driver circuit for the purposes of converting AC power to DC power. The PFC stage is also responsible for keeping the DC output voltage constant when the AC input voltage varies. However, its primary function is to correct the power factor on the AC input. It does this by sampling the waveform of the AC input current and comparing it to the AC voltage waveform. The AC input voltage has a much truer sinusoidal shape than the distorted and shifted AC input current. The PFC circuit “shifts” the AC input current back as close to the AC input voltage as possible. This corrects the displacement power factor (DPF). The PFC circuit also “fills in” the missing parts of the AC input current waveform. This corrects the power factor related to distortion — harmonic distortion of the current. The product of the DPF and harmonics-related power factor is called the true power factor (TPF). The objective of the PFC stage is to provide a TPF as close to unity as possible, which controls harmonic currents required by the driver.
The fifth stage is the DC-to-DC converter, which provides voltage and current regulation necessary to operate the LED array — or LED light engine. Over the last few years, this stage has become programmable. Using a programmable DC-to-DC converter allows the manufacturer to minimize the number of power converters while maximizing the number of LED light engines that one converter can operate. Voltage and current levels are programmable. Feedback from the LED light engine is provided back to the converter. Moreover, customer controls, such as dimming and LED tuning (i.e., varying the color of light that the LEDs generate), are “piped in” to the programmable converter as well. Hence, you can see that the programmable converter requires a lot of programmable digital components and circuitry to provide the type of lighting control customers desire as they improve the overall performance of their electronic-based lighting system.
Effects of PQ disturbances on LED drivers
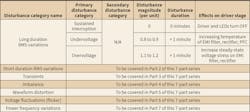
As you can see, multiple stages make up the advanced LED driver. Note: This driver doesn’t include any communications circuitry necessary to provide wireless lighting control over the LED driver. You can also see how the five stages of a driver are arranged with respect to the proximity of the AC line input where the disturbances enter the driver. The Table above lists the seven categories of disturbances (per IEEE 1159-2009, IEEE Recommended Practice for Monitoring Electric Power Quality), along with their primary and secondary categories. The disturbance magnitude and duration are also included along with information on the effects of the disturbance on specific driver stage(s).
RMS voltage variations generally are not the result of electric utility power system faults. They are caused by load variations on the system and system switching operations. The duration of voltage variations caused by these operations depends on the operation of voltage regulators and other types of voltage control on the power system (e.g., capacitor controls, generator exciter controls). The time required for response of these voltage controllers to system changes is at least seconds.
Long duration RSM voltage variations can be overvoltages or undervoltages, depending on the cause of the variation. It’s also important to consider voltage unbalance when evaluating steady-state or long duration voltage variations. Most end-use equipment isn’t sensitive to these voltage variations, if they’re within reasonable limits. For example, ANSI Standard C84.1 specifies the steady-state voltage tolerances expected on a power system. It recommends that equipment be designed to operate with acceptable performance under extreme steady state conditions of +6% and -13% of nominal system voltage (regarding 120/240V systems). Protective devices may operate to remove the equipment from service outside of this range. The most recent version of this standard includes recommended limits for voltage unbalance on the power system. Two ranges of permissible voltages are provided. Range A is for normal conditions. Range B is for short duration or unusual system conditions. The service voltage is the voltage at the end-user service entrance. The utilization voltage is the voltage at the actual end-use equipment, allowing for voltage drop across facility wiring.
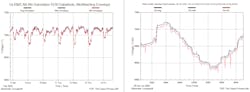
Figures 2A and 2B illustrate examples of long duration RMS voltage variations. The disturbance waveform of Fig. 2A shows the voltage regulation on a 12.5kV electric utility power distribution feeder during a one-week period. Shortly after midnight, the voltage drops 400V to 500V. Pole-mounted capacitor banks are switched on each day at around 5 a.m. to support the voltage. Notice that at about five hours after midnight each day the voltage increases significantly (see red arrows). The period of low voltage prior to switching the capacitors onto the distribution system is the long duration RSM voltage variation — a long-term undervoltage.
Figure 2B shows a similar example. Here, the voltage suddenly increases around 4 a.m. from around 6.8kV to about 7.05kV before it starts to steadily decline as the day’s load picks up.
In the remaining six parts of this series, we’ll discuss the effects of the other disturbance categories on LED drivers, addressing short duration RMS variations, transients, imbalance, waveform distortion, voltage fluctuations (flicker), and power frequency variations. In upcoming articles within this series, we’ll note the differences in how these disturbances impact driver performance with respect to normal operation, malfunction, and failure — and touch on latent damage to electronic components versus sudden damage.
Keebler is a senior power quality engineer and power systems consultant at Electrotek Concepts, Inc. in Knoxville, Tenn. He can be reached at [email protected].
About the Author
Philip Keebler
Senior Power Quality Engineer
Philip F. Keebler, MSEE has 32 years of experience in power quality (PQ) having worked for North American Philips, Electric Power Research Institute (EPRI), Electrotek Concepts & Dranetz. His experience spans across the utility revenue meter addressing PQ problems on the grid and inside residential, commercial and industrial customer facilities. His specialty areas include grounding, disturbances, harmonics, electromagnetic interference (EMI), equipment immunity, PQ monitoring, training and standards development. He serves as a Technical Advisor to PBE Engineers, LLC focused on understanding, identifying, solving and preventing (UISP) PQ problems in the industry and fostering new interest and workforce development to attract young engineers to developing careers in PQ. He can be reached at [email protected].