Ranking Electrical Disturbances ― Part 2 of 7
This article is Part 2 of a new seven-part series on the effects of power quality disturbances on a five-stage electronic LED driver. In Part 1, which ran in the April 2018 issue, we listed seven categories of electrical disturbances as defined in Table 2 per IEEE 1159-2009, Recommended Practice for Monitoring Electric Power Quality. Our discussion focused on long-duration RMS variations. We now turn our attention to short-duration RMS variations.
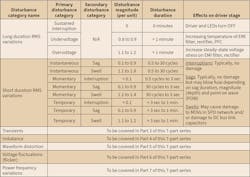
There are three primary disturbance categories — instantaneous, momentary, and temporary — in the short-duration RMS voltage variation category (Table 1). The instantaneous primary category is divided up into two secondary categories: sags and swells. Notice here that the durations are the shortest — 0.5 to 30 cycles (or 8.34 msec to 0.5 sec). The momentary primary category is divided into three secondary categories: interruptions, sags, and swells. Notice here that the durations are longer than those in the instantaneous primary category, ranging from 0.5 cycles to 3 sec for momentary interruptions and 30 cycles to 3 sec for momentary sags and swells. The temporary primary category is divided into three durations as well, but each has a greater than 3 sec to 1 min. duration. In terms of the voltage magnitudes for short-duration RMS voltage variations, sags are always less than or equal to 0.9 per unit (p.u.), and swells are always greater than 1.1 p.u.
When it comes to damage to LED driver electronics caused by these short-duration RMS voltage variations, voltage interruptions and sags aren’t the typical cause. Of course, interruptions and sags can occur at any time on the voltage sinewave. These disturbances take energy away from the LED driver, not add energy to it. With any disturbance, the exact time when the disturbance starts and ends is critical. Moreover, whether the driver’s power controller can maintain reliable control over its power electronic switches is the real question.
Almost all driver designs incorporate power factor correction (PFC) front-end circuits. PFC circuits operate based on timing set by the power frequency (60 Hz) of the voltage sinewave. Rarely, you will find that an interruption or voltage sag will cause an AC line fuse to blow, causing a driver failure.
The International Electrotechnical Commission (IEC) international standard, IEC 61000 series defines three classes for electrical environments where electronic equipment like LED drivers can be used. Part 4-1: Testing and Measurement Techniques – Voltage Dips, Short Interruptions and Voltage Variations Immunity Tests defines the test limits for determining if interruptions and sags might cause unacceptable LED driver operations when these disturbances are incident on the AC line voltage inputs of LED drivers. Designers and test engineers of LED drivers should be careful to define the electrical environments where drivers may be used. Part 4-11 also provides a general Class X for duration and magnitude test points, so specific driver designs (i.e., topologies) can be studied in more detail with respect to immunity to short-duration RMS variations. These should be applied to help ensure interruptions and sags don’t cause permanent unrecoverable damage to drivers installed in customer electrical environments.
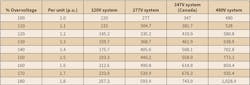
Voltage swells are thought of as the opposite of voltage sags. When swells occur, energy is added to the 60-Hz voltage sinewave. End-use electronics must be able to dissipate the added energy without damaging on-board passive or active electronic components. Swells are increases in the RMS voltage above 1.1 p.u. for durations from 0.5 cycle to 1 min. Typical magnitudes of swells range between 1.1 p.u. and 1.2 p.u. Table 2 illustrates the possible voltage swell values for 120V, 277V, 347V and 480V nominal power system voltages. You can see that swell voltages can reach high levels. Actual cases of damage to LED drivers have occurred for values as high as 1.5 p.u.
Swell magnitudes are also described by their remaining voltage. Voltage swells are much less common than voltage sags, and the magnitudes are not usually severe. The most common cause is a single line-to-ground (SLG) fault condition. During a SLG fault, the voltage on the unfaulted phases can increase due to the zero-sequence impedance. On an ungrounded system, the voltage on the unfaulted phases can be as high as 173% (row 8 in Table 2). On most systems, the voltage swell is less than 140%. The term swell is a relatively newly defined term in the sense of power quality. Before the term swell was introduced into the power quality community, the commonly used terms to describe these types of disturbances were surge and momentary overvoltage.
Interruptions, sags, and swells are low-frequency power quality phenomena. Their disturbance waveforms will enter the AC protection network, which typically contains the AC line fuse, surge protective device (SPD) network and electromagnetic interference (EMI) filter. It is the AC protection network that has a higher risk of experiencing damage from swells than any other part of the LED driver circuit. If any of the components downstream of the AC line fuse suffer damage, the fuse is likely to blow. Damage to the SPD network depends on how the metal oxide varistors (MOVs) are used in the network and what their ratings are. Most designers of LED drivers don’t consider the driver’s exposure to voltage swells when specifying or designing the SPD network.
The rectifier stage is less likely to experience damage caused by swells, especially if 1,000V diodes are not used. However, the DC filtering stage, where the DC link capacitor(s) are located, is the next stage likely to experience damage caused by the driver’s exposure to swells. Electrolytic capacitors are not cheap, and most designers don’t provide enough headroom in the maximum DC working voltage to handle swells. You should also remember that too much exposure to swells, which causes the voltage on the capacitors to exceed the maximum DC working voltage, will cause damage to the capacitor’s dielectrics. Most electrolytic capacitors start to experience damage caused by voltage swells before capacitor lids will start to lift. The PFC transistor in the PFC stage may also experience damage, some catastrophic, when swells reach high values likely to damage semiconductor devices like power diodes and MOSFETs. Also, damage to passive and active small signal and power electronics can cause overheating of circuit traces and power-related components as the dielectrics of electrolytic capacitors start and continue to experience damage caused by voltage swells.

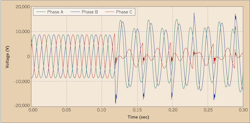
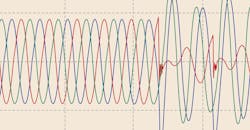
Figure 1A illustrates a typical voltage swell that occurs on the unfaulted phases close to a single line-to-ground fault on an overhead power distribution system. Notice here that the AC line voltage rose to almost 1.4 p.u. on Phase A (red) with a duration of about 0.65 sec (or 39 cycles) followed by a voltage sag to near zero voltage. Figure 1B illustrates 9-cycle voltage swells on Phases A and B followed by voltage sags on Phase C that occurred on a customer’s medium-voltage power distribution bus. These swells are not symmetrical about the zero-voltage axis. Here, the swell on Phase A was higher than on Phase B. The swell then experienced some transient voltage conditions. The sags on Phase C also show some transient voltage conditions mixed with the sags.
In the remaining five parts of this series, we’ll discuss the effects of the other disturbance categories on drivers, addressing transients, imbalance, waveform distortion, voltage fluctuations (flicker), and power frequency variations.
Keebler is a senior power quality engineer and power systems consultant at Electrotek Concepts, Inc. in Knoxville, Tenn. He can be reached at [email protected].
About the Author
Philip Keebler
Senior Power Quality Engineer
Philip F. Keebler, MSEE has 32 years of experience in power quality (PQ) having worked for North American Philips, Electric Power Research Institute (EPRI), Electrotek Concepts & Dranetz. His experience spans across the utility revenue meter addressing PQ problems on the grid and inside residential, commercial and industrial customer facilities. His specialty areas include grounding, disturbances, harmonics, electromagnetic interference (EMI), equipment immunity, PQ monitoring, training and standards development. He serves as a Technical Advisor to PBE Engineers, LLC focused on understanding, identifying, solving and preventing (UISP) PQ problems in the industry and fostering new interest and workforce development to attract young engineers to developing careers in PQ. He can be reached at [email protected].