Power BI Dashboards for Construction Estimating: Smarter Data Visibility
Key Highlights
- Power BI transforms raw estimating and project data into live, interactive dashboards that support quick decision-making.
- Integrating estimating software with ERP systems via APIs ensures data is current, structured, and easily visualized in Power BI.
- Dashboards focusing on bid pipeline, win rates, and cost variances help contractors identify opportunities and mitigate risks.
- Visualizing labor and material cost variances enables better resource planning and margin control across projects.
- Structured, accessible data allows estimators and managers to move beyond gut-feel decisions toward data-driven strategies.


Construction estimating has a data problem, though not the kind you'd expect. It isn't a lack of data. After years of bids, most electrical and MEP contractors are sitting on a mountain of it: win rates, labor hours, material costs, change orders, project timelines. Almost none of it is visible in a way that's useful.
In our last article we made the case for why ERP integration matters for modern estimating teams. Connecting your estimating software to your business systems eliminates manual data transfer, reduces errors, and creates a single source of truth across your operation. But moving data between systems is infrastructure, not insight. What you do with that data once it's connected is where the competitive advantage lives.
That's where Power BI comes in. For mid-size and enterprise electrical and MEP contractors, Microsoft Power BI has become the standard tool for turning estimating and job cost data into something you can act on.
What Is Power BI and Why Does It Matter for Contractors?
Power BI is Microsoft's business intelligence and data visualization platform. It connects to virtually any data source, including your ERP, your estimating software, spreadsheets, and project management tools, and turns raw data into live, interactive dashboards and reports. Instead of static monthly exports that are already outdated by the time they land in your inbox, you get a current view of what's actually happening across your business.
Two things make it practical for contractors specifically. It integrates with Microsoft 365, which most contractors are already running, and it has a free tier, so getting started doesn't require a software purchase. This isn't a tool reserved for enterprise companies with dedicated IT departments. Mid-size specialty contractors with a connected tech stack and clean data are running meaningful Power BI dashboards today, and the ones who aren't are starting to feel the gap.
The Real Problem: Estimating Data That Goes Nowhere
Even contractors who have done the hard work of integrating their estimating software with an ERP hit the same wall: the data is connected, but it still isn't visible. It lives in database tables and accounting modules, accessible in theory and buried in practice. Answering a question like "what's our win rate on commercial electrical projects over $500K this year?" means running a custom report, exporting to a spreadsheet, or asking someone in finance to dig through the numbers. Most estimating teams don't have time for that, so strategic decisions get made on gut feel and anecdotal memory instead. Modern estimating tools have come a long way in handling the volume and complexity of bid work, but speed and accuracy at the bid stage only create more data that needs somewhere useful to go.
A study by Autodesk and FMI, Harnessing the Data Advantage in Construction, estimated that bad data cost the global construction industry $1.85 trillion in 2020. Overbidding, underbidding, chasing the wrong project mix: those costs compound across every job you touch. Power BI won't fix data quality, which is always an upstream problem. But once your estimating and ERP data is clean and connected, Power BI is what makes it legible.
Power BI Dashboards: What Estimating Teams Actually Need to See
The most valuable use of Power BI for electrical and MEP contractors is giving your estimating team, operations leadership, and project managers a shared view of the metrics that actually drive margin and growth. Here's what meaningful Power BI dashboards look like for contractors in practice.
Bid Pipeline and Win Rate Visibility. How many bids are active right now? What's your win rate over the last 12 months, and how does it break down by project type, client, or region? Most estimating teams can't answer those quickly, or accurately. A dashboard pulling from your estimating software gives leadership a live view of not just where you've been bidding, but where you're winning. Layer in pricing history and bid volume by quarter and you get the retrospective view that sharpens forward strategy: which clients you consistently win with, and which project types carry the best margin.
Estimated vs. Actual Cost Tracking. This is the most valuable dashboard for any contractor doing post-bid analysis. When your estimating data connects to your ERP's job cost records, you can compare what you quoted against what you spent on labor, materials, and subcontracts across every completed project. If you're consistently running over on a type of labor or under on material for certain scopes, that goes straight back into your next bid. Without visibility, those variances get absorbed silently into your margin.
Labor Performance by Project Type. Field hours, shop hours, incidental labor: most estimating software tracks these in detail. Power BI aggregates them across hundreds of jobs and surfaces the trend. Which project categories are your crews consistently finishing under or over on? Where is your labor model working, and where does it need recalibration?
Material Cost Variance. How often does procurement land close to the estimate? If your estimating software captures real-time supplier pricing, you can visualize how market fluctuations move your actual costs against what was quoted at bid time. For electrical and mechanical contractors especially, pricing drift between bid and procurement quietly erodes margin on jobs that looked healthy on paper.
A Power BI Dashboard Example: Public Tender Data in Action
The best way to understand what Power BI can do for a construction estimating operation is to see it in action. One of the clearest power BI dashboard examples we've built around construction data comes from our work with Pontem Innovations, an Edmonton-based data analytics firm specializing in Power BI, Azure, and workflow automation for complex industries.
Using PataBid's public tender data, Pontem built a set of Power BI dashboards that visualized construction bid activity across regions — surfacing patterns in project volume, award values, and market activity that would be invisible in a raw data export. The dashboards pulled structured tender data and rendered it as interactive visual reports: filterable by region, project type, value range, and time period.
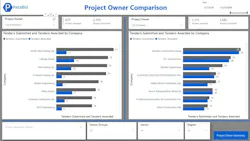
What makes this a useful example for estimating teams isn't the specific product — it's the principle it demonstrates. When construction data is structured, accessible via API, and connected to a tool like Power BI, the output isn't just a prettier spreadsheet. It's a genuinely different way of reading a market. Estimators looking at that kind of dashboard can see where bid activity is concentrated, where award values are trending, and where competition is thinner — context that sharpens every bid/no-bid decision they make before a single estimate is started.
The same logic applies to your internal estimating data. The patterns are there. Power BI is what makes them visible.
Power BI Dashboard Designs: Matching the View to the Decision
Power BI dashboard designs for estimating teams should be built around specific decisions rather than generic reporting, and the same underlying data can feed multiple views, each filtered and formatted for a different audience.
The most effective designs for construction share three traits. They prioritize comparisons over raw totals: estimated vs. actual, this quarter vs. last quarter, this project type vs. that one. They surface outliers and variances rather than averages that mask problems. And they're built to be read in a Monday morning glance, not a two-hour deep dive.
Power BI Integrations: How Your Estimating Software Feeds the Dashboard
Power BI integrations are only as good as the data flowing into them. For contractors, that means your estimating software needs to be able to export structured, granular data that Power BI can connect to and refresh on a regular schedule. Flat file exports — CSV or Excel dumps — work in a basic sense, but they introduce manual steps and create version control headaches. A proper API connection is what makes the integration genuinely useful, because it means your dashboards are always pulling from current data without anyone manually triggering an export.
The data points that matter most for estimating analytics aren't always what basic integrations provide. You need project metadata so you can slice your analytics by the dimensions that actually matter for your business. And you need the comparison layer: the ability to link a specific estimate back to the actual job cost record in your ERP so you can see exactly where the two diverge.
At PataBid, our API is built specifically to support this kind of downstream data use. Contractors can extract full estimate data including bid summaries, labor breakdowns, bill of materials, cost code mappings, and historical bid analytics — all through a structured API that connects cleanly to external business intelligence tools. The data that lives inside Quantify is the foundation of everything a Power BI dashboard needs to work.
The Strategic Case: Why This Matters Now
The contractors who will own the next decade of electrical and MEP construction aren't the ones with the most estimators or the most aggressive pricing. They're the ones who understand their own performance data well enough to make faster, better decisions than their competition. That means knowing your true win rate. It means understanding where your margin actually comes from and where it quietly leaks away. It means walking into a planning meeting able to show, with data, whether you should be pursuing more of a certain project type or walking away from a market that looks good on the surface and consistently underperforms.
The technology to do this exists today. The contractors building toward it now gain an advantage that compounds over time: more refined bidding, better resource planning, and a clearer picture of where growth actually makes sense.
Ready to Connect PataBid Quantify to Your Power BI?
PataBid's API gives you the data access you need to build a real Power BI integration for your estimating operation. Whether you're working with your own development team, a systems integrator like Pontem Innovations, or simply evaluating what this could look like for your business, we can walk you through exactly what data is available through the Quantify API and how it maps to your reporting needs.
Book a demo today to talk through your Power BI integration goals and how PataBid fits into your data strategy.
Bio: Melvin Newman, C.E.T., is the co-founder and CEO of PataBid, bringing nearly two decades of hands on MEP estimating experience to the development of AI powered construction technology. His background as a Certified Engineering Technologist, seasoned estimator and full stack developer gives him a rare perspective on where the construction industry and emerging technology meet.